Kanaries: AI-Powered Data Visualization and Analysis
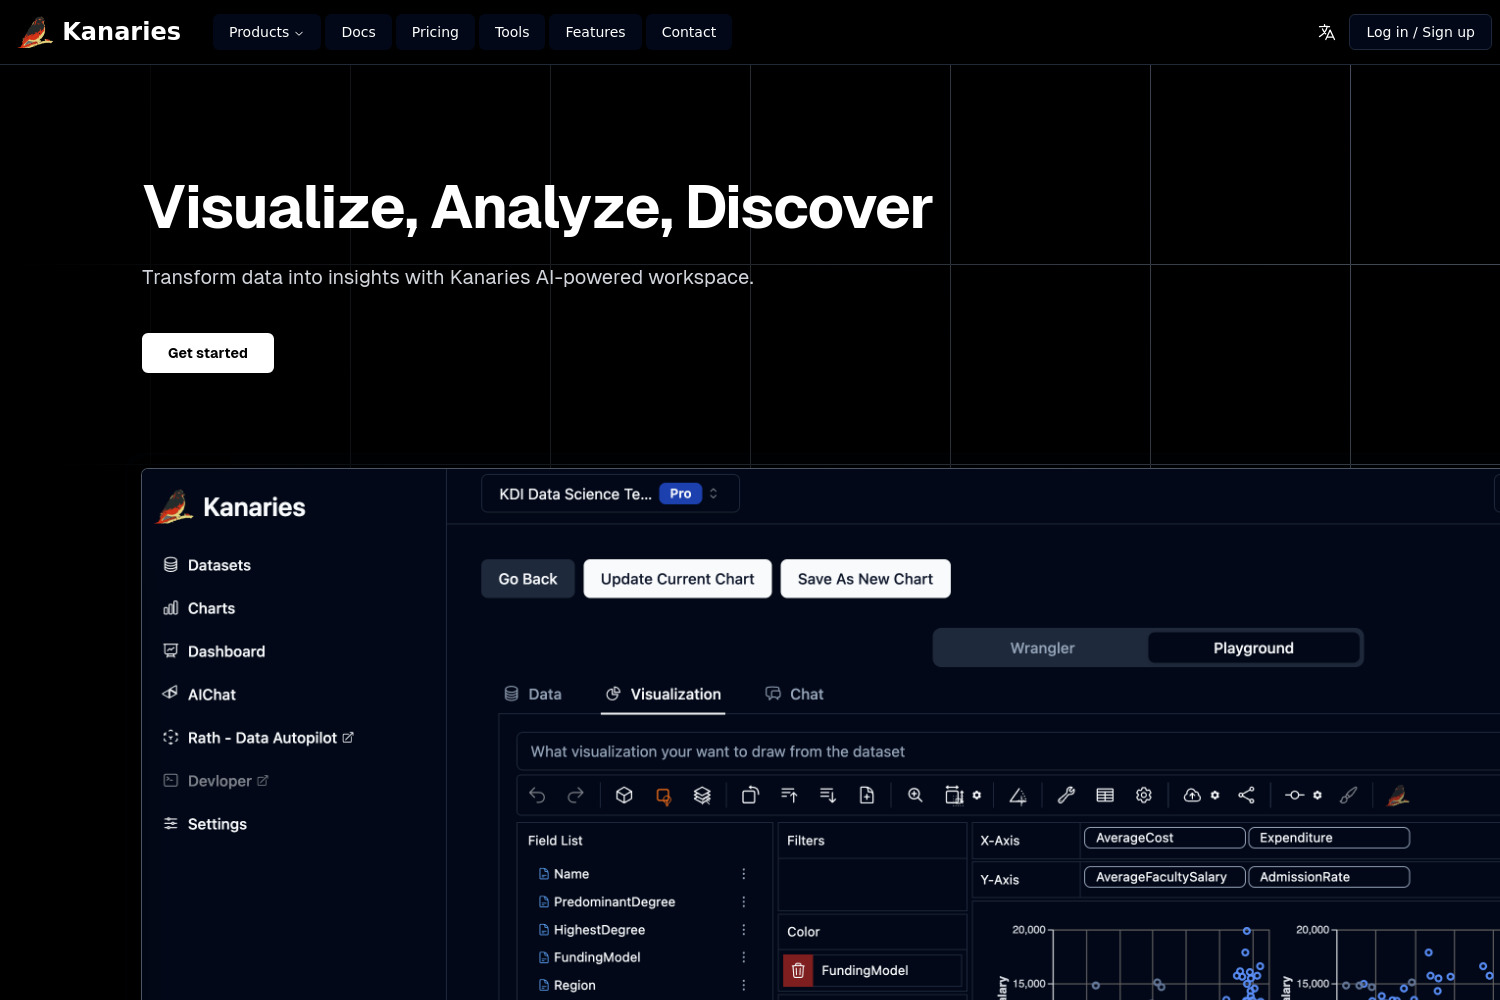
Kanaries is an AI-powered platform designed to simplify the process of data visualization and analysis. Aimed at data scientists and analysts, Kanaries enables users to effortlessly explore and analyze datasets, transforming raw data into actionable insights. With core features like PyGWalker and RATH, Kanaries offers an intuitive workspace where users can create interactive visualizations, generate automated insights, and make data-driven decisions more efficiently.
AI-Powered Visual Analytics
At the heart of Kanaries is its AI-powered visual analytics functionality. This feature allows users to easily create interactive data visualizations without requiring deep programming knowledge. Leveraging advanced machine learning algorithms, Kanaries suggests the most appropriate visualizations based on the user's data, making it an invaluable tool for users who may not have extensive data science backgrounds. This automated visual analytics process ensures that users can quickly derive meaningful insights, even from large and complex datasets.
Automated Data Insights with RATH
Kanaries features RATH, an Augmented Analytics Engine, that automates the process of generating valuable data insights. By analyzing datasets, RATH identifies key trends, anomalies, and correlations, saving users time on manual data analysis. This automation enables users to receive immediate insights and feedback, helping them make informed decisions faster. While RATH provides powerful insights, users should still apply their domain knowledge to validate the findings.
Interactive Data Applications with PyGWalker
Another standout feature of Kanaries is its ability to transform dataframes into interactive applications using tools like PyGWalker and GWALKR. These tools enable users to visualize data in Python and R, respectively, making it easier for data scientists and analysts to create interactive presentations for stakeholders. With PyGWalker and GWALKR, users can share their insights in an engaging and intuitive format. However, some technical knowledge of Python or R may be required to fully utilize these tools.
Embeddable Data Visualizations with Graphic Walker
Kanaries also offers Graphic Walker, an embeddable data visualization component in JavaScript. This feature allows developers to integrate interactive visualizations directly into their web applications, enhancing the way data is presented to users. It’s a practical solution for organizations looking to improve their data presentation capabilities without having to build custom visualization solutions from scratch. However, a basic understanding of JavaScript is necessary to implement this feature effectively.
Community and Support
Kanaries provides a robust support system to assist users in maximizing the platform's potential. The Kanaries community offers a space for users to connect, share experiences, and ask questions. Additionally, comprehensive documentation is available, providing tutorials and guides to help both new and experienced users navigate the platform and fully utilize its features.
Conclusion
In summary, Kanaries offers an AI-powered workspace designed to simplify the data analysis and visualization process. With powerful features like RATH for automated insights, PyGWalker for interactive data applications, and Graphic Walker for embeddable visualizations, Kanaries provides a comprehensive solution for data scientists and analysts looking to enhance their workflow. By making exploratory data analysis more intuitive and accessible, Kanaries empowers users to make better, data-driven decisions faster.
Frequently Asked Questions
What is Kanaries?
Kanaries is an AI-powered platform designed to simplify exploratory data analysis (EDA) through visual analytics. It helps users transform data into actionable insights with interactive tools and automated insights.
What features does Kanaries offer?
Kanaries includes AI-powered visual analytics, interactive data applications via PyGWalker and GWALKR, automated insights with RATH, and embeddable visualization components via Graphic Walker.
How does Kanaries enhance user experience?
Kanaries enhances user experience with an intuitive interface, AI-powered tools, and personalized recommendations based on user behavior. The platform is designed to be easy to use, even for users without a deep technical background.
What support options are available for Kanaries users?
Kanaries offers comprehensive documentation, community support through Discord, and an FAQ section for quick solutions to common issues.
What are the future development plans for Kanaries?
Kanaries plans to continually improve its features and add new tools based on user feedback. Future updates will enhance data analytics and visualization capabilities, ensuring that the platform evolves to meet user needs and market trends.
