Line Graph Maker - Create Custom Line Charts for Free
Introduction
Line Graph Maker is an intuitive, user-friendly tool designed to streamline the process of data visualization. Whether you are a student, a professional, or someone in need of clear data presentation, this platform makes it effortless to create stunning and customized line charts. With the free graph maker, you can tailor your graphs to suit specific needs, ensuring that every visual representation is both clear and engaging.
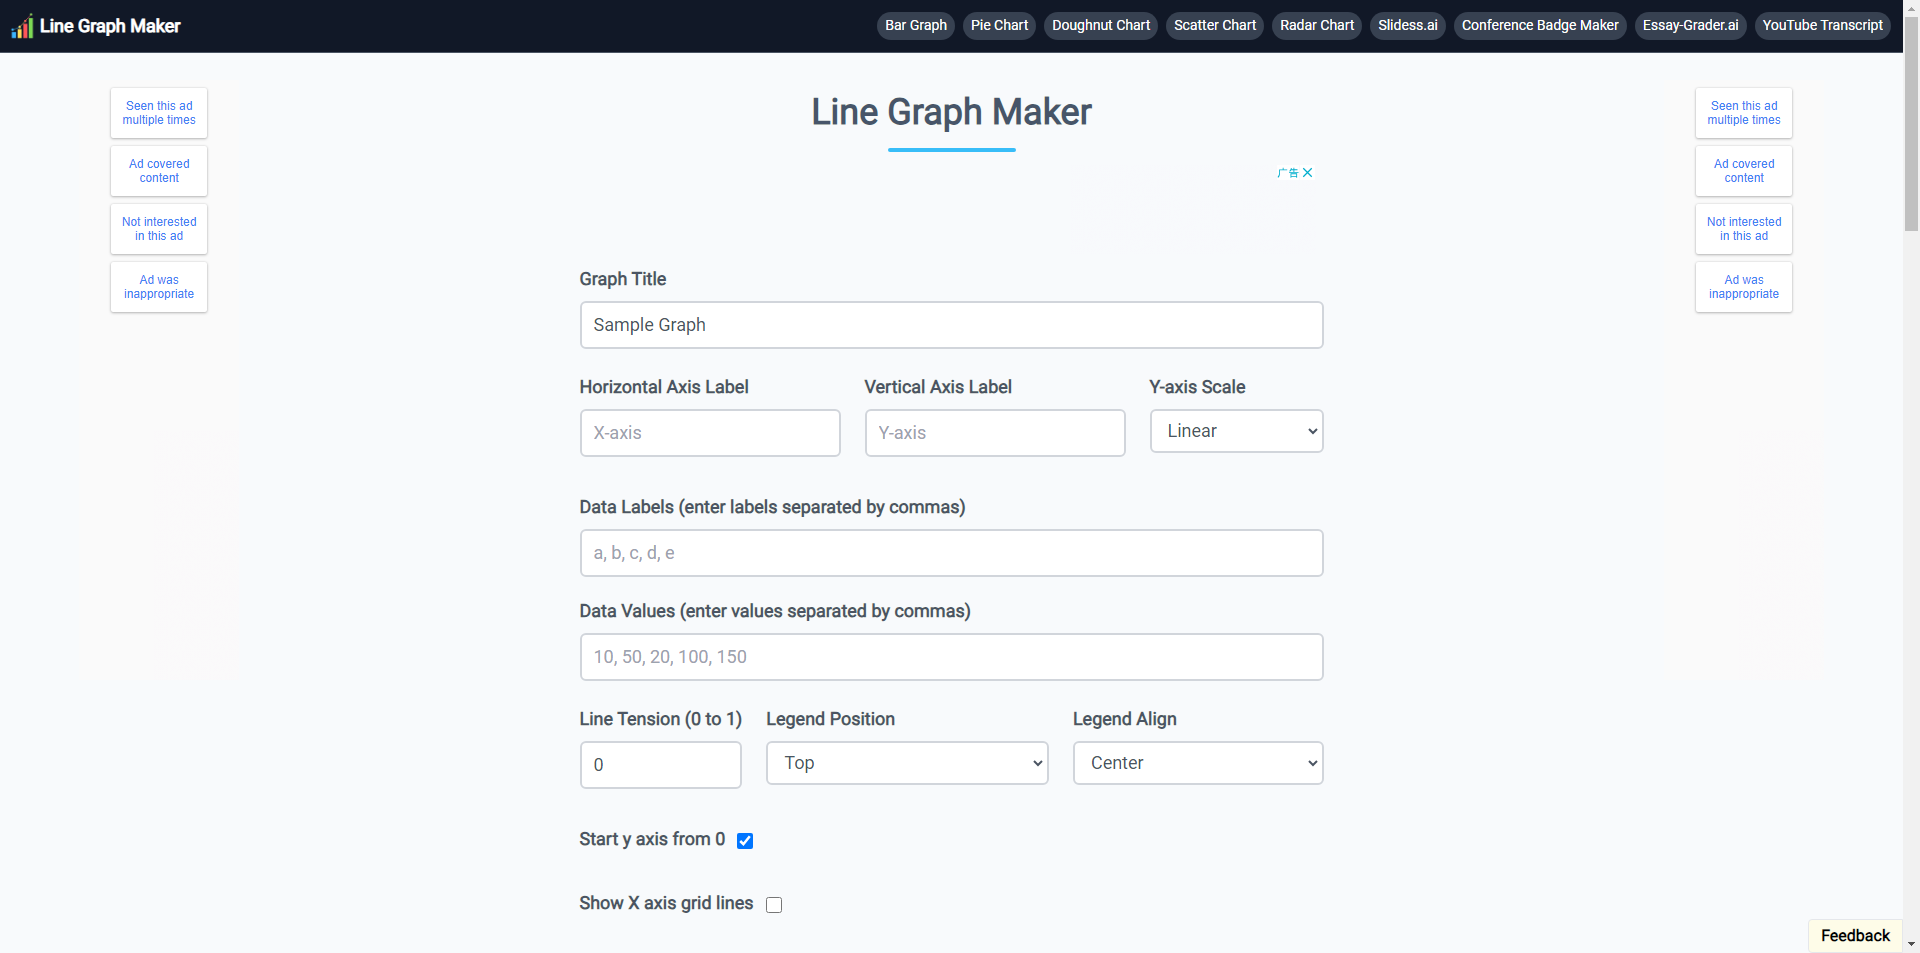
The Line Graph Maker allows seamless data input and offers a straightforward interface that guides you step-by-step in creating your charts. From adding titles and labels to adjusting line tension and color schemes, every aspect is customizable to ensure your data is conveyed effectively. This tool is ideal for anyone looking to turn complex data into easy-to-understand visuals, making it an essential resource for clear communication across various fields.
Features
Overview
The Line Graph Maker is a powerful online tool that helps users create professional-quality line charts effortlessly. Its intuitive interface makes the graph-making process simple, fast, and customizable.
Main Purpose and Target Audience
The primary goal of the Line Graph Maker is to enable users to create high-quality line charts for free, enhancing data visualization for different applications. It is designed for a broad range of users, including:
- Students
- Educators
- Researchers
- Business professionals
Functionality and Features
- Customizable Line Charts: Add titles, axis labels, and input data values.
- Y-Axis Scaling: Options for both linear and logarithmic scales.
- Line Tension Adjustment: Smooth curves or sharp lines to best represent your data.
- Legend Positioning: Choose from various legend positions and alignments.
- Grid Line Customization: Add or remove grid lines for clarity.
- Multiple Download Formats: Export your charts in PNG, JPG, and SVG formats.
User Benefits
- Completely Free: Access all features at no cost, with no hidden charges.
- Ease of Use: The process is simple and intuitive, making it easy to create professional charts quickly.
- Full Customization: Personalize your graphs to suit your unique needs.
- Quick Downloads: Easily download and share your graphs in the format of your choice.
Compatibility and Integration
The Line Graph Maker is a web-based tool, ensuring compatibility across multiple devices and operating systems. It integrates easily with other data visualization tools and can work alongside popular platforms such as Google Sheets and Excel.
Access and Activation
Using Line Graph Maker is as simple as visiting the website at https://linegraphmaker.co. There’s no need to sign up or pay any fees—you can start creating line charts right away.
Frequently Asked Questions
1. What is the Line Graph Maker?
The Line Graph Maker is a free online tool that allows users to create customized line charts for effective data visualization.
2. How do I create a line chart using the Line Graph Maker?
To create a line chart, simply add a title, label the horizontal and vertical axes, enter your data labels and values (separated by commas), adjust line tension, choose the legend position, and customize grid lines. Once completed, download your chart in PNG, JPG, or SVG format.
3. Is the Line Graph Maker free to use?
Yes, the Line Graph Maker is completely free to use. You can create and download your line charts without any charges.
4. Can I customize my graphs?
Absolutely! The Line Graph Maker offers extensive customization options, allowing you to change line colors, axis labels, grid lines, and legend positions to suit your needs.
5. What formats can I download my line chart in?
You can download your line chart in multiple formats, including PNG, JPG, and SVG.
6. Do I need to create an account to use the Line Graph Maker?
No, you don’t need to create an account to use the Line Graph Maker. Simply visit the website and start creating your charts immediately.
7. Can I use the Line Graph Maker for educational purposes?
Yes, the Line Graph Maker is a perfect tool for students and educators to visualize data for projects, presentations, and assignments.
8. What types of graphs can I create with the Line Graph Maker?
Besides line graphs, you can also create bar graphs, pie charts, doughnut charts, scatter charts, and radar charts with our comprehensive graph-making suite.
9. Is there a limit to the amount of data I can input?
While there is no strict limit, we recommend keeping your data manageable to ensure better visualization and clarity in your line charts.
10. Where can I find more information or support for using the Line Graph Maker?
You can find more information, tips, and tutorials on our website or by exploring our blog, which offers guidance on data visualization best practices.
