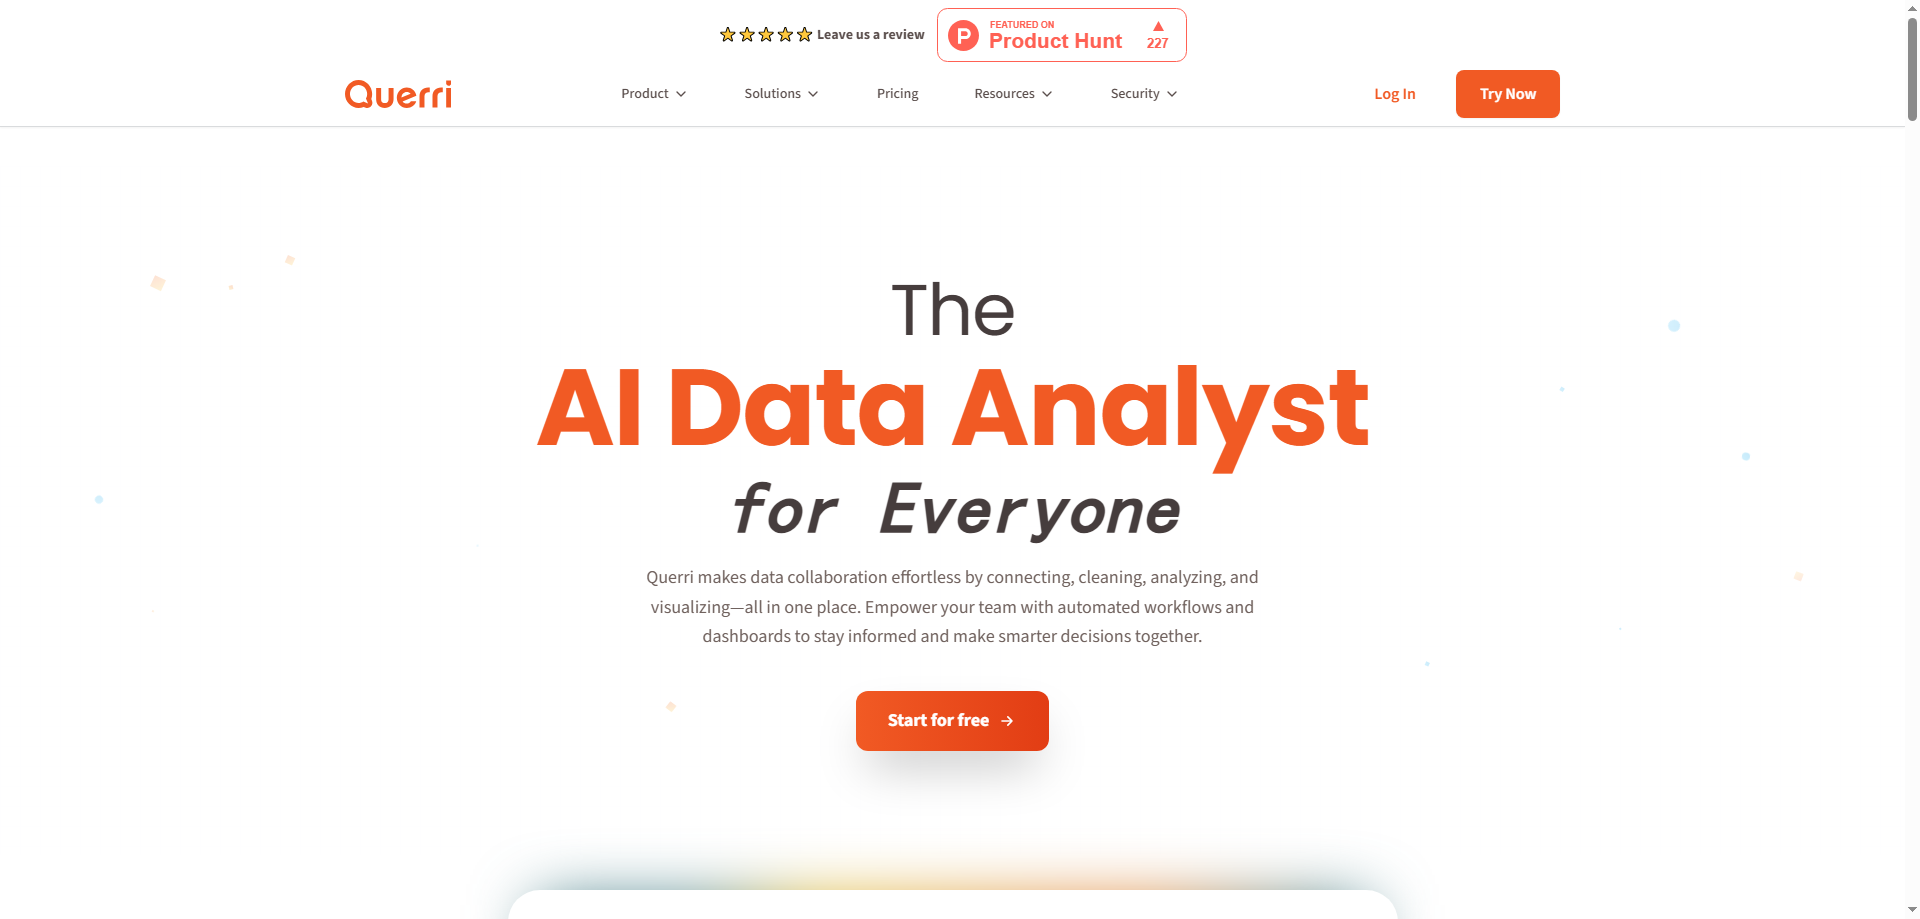
Introduction to Querri 2.0
When I first tried Querri 2.0, it felt like someone had finally built the data tool I always wanted but never imagined was possible. Instead of wrestling with spreadsheets, jumping between dashboards, cleaning messy files, or begging data engineers for help, I suddenly had a smart assistant that could connect data sources, clean them, analyze them, visualize insights, and share results—all in one place.
And the best part? I didn’t need to write a single line of code.
Querri 2.0 blends data analysis, data visualization, report generation, business intelligence, automated data processing, and natural-language querying into a single flexible platform. For teams that lack technical expertise or dedicated analysts, this feels like a superpower.
Now let’s break it down from four angles: creativity, disruption, user demand, and its one-year survival outlook.
Creative Angle: How Querri 2.0 Reinvents Data Work
Making Data Feel Playful and Human
The first creative breakthrough is how Querri 2.0 makes data feel approachable—even fun. Instead of burying me in settings or formulas, it lets me drag and drop data elements like I’m building a puzzle.
Connecting data sources feels effortless, cleaning them feels visual, and creating dashboards feels like designing something—not coding something.
In a world where BI tools often feel rigid and intimidating, Querri 2.0 plays with the idea that data should be fluid, intuitive, and visually expressive.
Natural Language as a Creative Interface
The natural language feature is my personal favorite. I literally type:
- “Which product performed best last quarter?”
- “Show me this month’s user engagement trend.”
- “What region generated the highest revenue?”
And Querri 2.0 responds instantly with charts, explanations, and insights.
This is creative because it removes the barrier between curiosity and discovery. I don’t need to translate my thoughts into SQL or formulas. I just ask like I’m talking to a teammate.
Visualizing Insights Instantly
The interactive dashboards feel almost like digital art boards:
- drag a metric
- drop a chart
- connect a dataset
- build a live, updating dashboard
It’s creativity meeting business intelligence. Instead of static reports, I can design dynamic experiences that help my team explore data from angles we’d never considered before.
Disruptive Angle: Can Querri 2.0 Replace Traditional BI Tools?
Replacing Manual Data Cleaning and Preparation
Traditional data tools demand:
- hours of preparation
- expertise in formulas
- repeated manual steps
- constant spreadsheet maintenance
Querri 2.0 disrupts this by automating data cleaning:
- fixing inconsistencies
- handling duplicates
- formatting fields
- preparing data pipelines
This alone removes nearly 50% of the average analyst’s workload.
Challenging Legacy BI Platforms
Legacy business intelligence systems are:
- expensive
- difficult to customize
- dependent on specialists
- slow to update
- unfriendly for beginners
Querri 2.0 flips the script with:
- no-code setup
- natural language queries
- drag-and-drop dashboards
- automated workflows
- fast, shareable insights
It targets a huge gap: teams who need BI but don’t have data engineers.
The Rise of No-Code Data Analytics
No-code tools are already disrupting design, automation, and prototyping. Querri 2.0 is doing the same for data analysis. It democratizes analytics, making it possible for anyone—not just specialists—to answer questions, build dashboards, and generate insights.
This positions Querri 2.0 as a real challenger in the business intelligence space.
User Demand: Will Teams Actually Adopt Querri 2.0?
Meeting Real, Everyday Business Needs
Teams struggle with:
- messy data
- slow reports
- siloed information
- lack of technical expertise
- unclear insights
Querri 2.0 addresses all of this in one place.
Whether it’s a marketer analyzing campaigns, a sales manager reviewing territories, or a startup tracking weekly metrics, Querri 2.0 solves real, recurring pain points.
Lowering the Technical Barriers
Most people don’t know SQL, Python, R, or Power BI formulas. But everyone can ask questions in plain English.
That’s why the natural language interface is so powerful—it meets users where they already are.
Collaboration as a Driving Force
Shared dashboards, automated reports, and team-ready insights mean Querri 2.0 naturally fits into team workflows.
This increases adoption because value is shared—not isolated.
One-Year Survival Rating: 1–5 Stars
My Rating: ⭐⭐⭐⭐⭐ (4.3 out of 5)
I believe Querri 2.0 has a strong chance of thriving over the next year. It’s creative, disruptive, and genuinely useful—three things many BI tools struggle to combine.
Here’s why it earns 4.3 stars:
- It solves real, daily problems.
- It offers unique value with natural-language analysis.
- It makes BI accessible to non-technical teams.
- It reduces the cost and complexity of traditional tools.
But it does face some challenges.
Opportunities for Growth
-
Deeper AI-powered recommendations Turning insights into automated business suggestions.
-
More data connectors Adding integrations for niche databases, CRM tools, and warehouse platforms.
-
AI-generated dashboards Dashboards that build themselves based on user queries.
-
Predictive analytics Using historical data to forecast revenue, churn, or demand.
-
Team collaboration modes Real-time editing and multi-user dashboards would be huge.
Risks Querri 2.0 Must Overcome
-
Competition in the BI landscape Big players could adopt natural language faster.
-
Data accuracy and trust concerns If results are inconsistent, users may hesitate.
-
Performance with very large datasets Scalability matters for enterprise adoption.
-
Feature overload Adding too much too quickly might compromise simplicity.
-
User education Teams need guidance to unlock the tool’s full power.
Still, none of these risks feel fatal—just important challenges to navigate.
Practical Use Cases That Show Real-World Value
Marketing Campaign Analysis
I can connect ad data, clean it automatically, ask “Which ads drove the most conversions last month?”, and get instant bar and line charts.
No spreadsheets. No pivot tables.
Sales Reporting and Forecasting
Drag CRM, finance, and territory data into a dashboard and see:
- revenue by region
- profit by product
- trends over time
I can even automate weekly reports.
Product Feedback Insights
Upload survey data, then ask:
- “What features do users mention most often?”
- “What do users like about the new update?”
Querri 2.0 returns keyword clouds, sentiment views, and frequency charts.
Small Teams Without Data Analysts
Startups can finally make data-driven decisions without hiring specialists.
Natural-language queries mean everyone can participate.
FAQs
1. Do I need coding skills to use Querri 2.0? No. It’s fully no-code and designed for beginners.
2. Can it replace my existing BI tool? For many teams—yes. For advanced enterprise cases—it may complement rather than replace.
3. Does it handle multiple data sources? Yes. It connects to spreadsheets, cloud tools, and databases.
4. How does natural-language analysis work? You type a question; the system analyzes your data and generates visual results.
5. Are dashboards shareable? Absolutely. Sharing insights is one of its core features.
6. Can it automate routine reports? Yes. You can schedule workflows that run automatically.
Conclusion
Querri 2.0 isn’t just another dashboard tool—it’s a creative, intuitive, no-code data assistant that removes the friction between questions and answers. It democratizes data analysis, empowers teams, and reimagines what business intelligence can feel like.
With a 4.3-star survival rating, plenty of opportunities for growth, and strong real-world usefulness, I believe Querri 2.0 has a promising future ahead.